| Version 8 (modified by , 9 years ago) (diff) |
|---|
Copilot
copilot.py is a script that watches for new images, measures them,
and produces a plot, recent.png to help observers understand what
the conditions are doing.
Start it from the mzls@mayall-idl.kpno.noao.edu account,
cd ~/obsbot
python copilot.py &
eog recent.png &
It will monitor the $MOS3_DATA directory, and whenever a new image comes it, it will measure it, update a little database, and create a "strip plot" showing the conditions.
The database is in ~/obsbot/obsdb/obsdb.sqlite3.
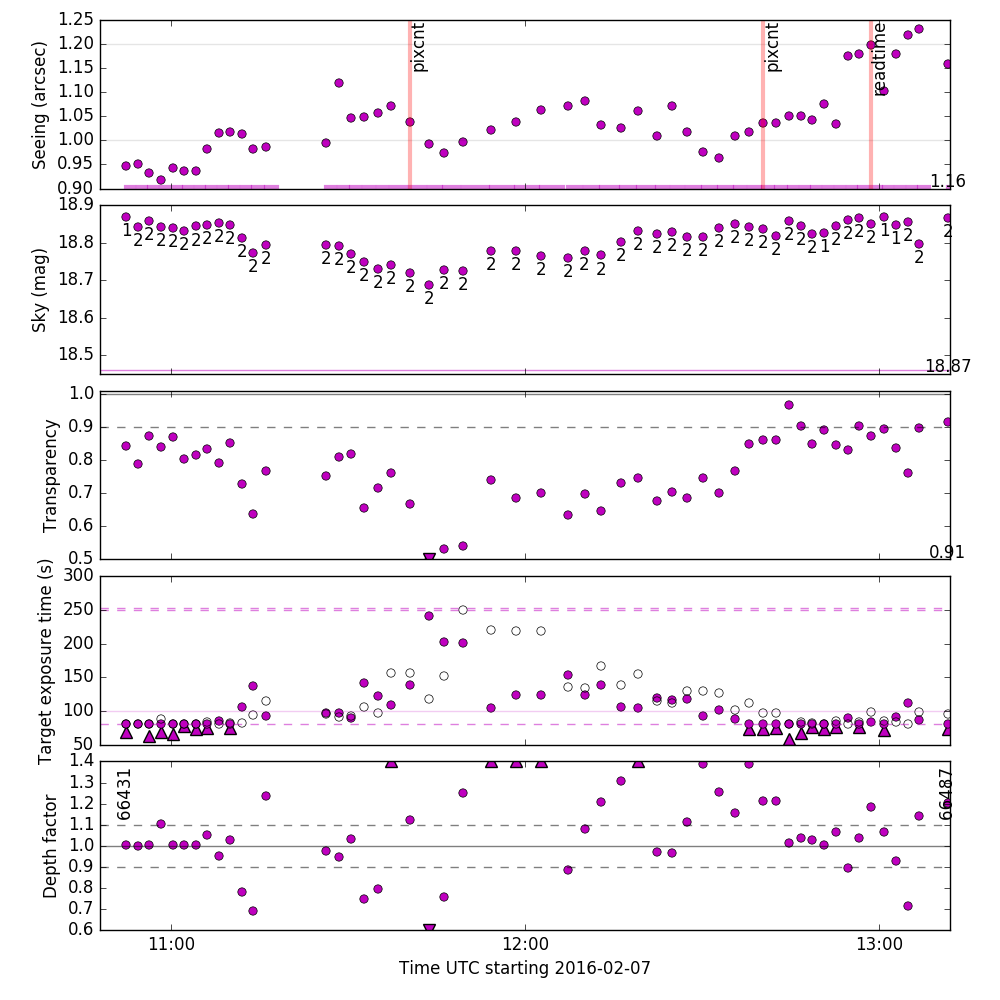
An example plot is shown here:

The top panel shows the seeing. Any problems with the data we know how to detect are marked with red vertical bands. These include:
- readtime -- MAY indicate a duplicated image ("md5sum" is a better indicator). ALSO, typing "hselect mos3*fits[0] $I,readtime yes" in the IRAF window can show you the readtime header jkeyword values for the images. If the last several are identical, then this requires action.
- md5sum -- this image contains identical pixels as a previous image. This requires action! Please see the problem description https://desi.lbl.gov/trac/wiki/PublicPages/MayallZbandLegacy/NotesforObservers/Problems#a5.Repeatimages HERE.
- pixcnt -- the image readout is shifted. Please have a look at this exposure and note in the logs which CCD has the shift. The shifts are pretty easily recognized in the *mscexam* IRAF window -- blocks of one of the images will be shifted to the left or right. Do not stop observing. This problem is described https://desi.lbl.gov/trac/wiki/PublicPages/MayallZbandLegacy/NotesforObservers/Problems#a4.Shiftedimages here
- (unlabelled bar) -- it has been a while since the last image has been seen. Have images stopped being written? See problem description https://desi.lbl.gov/trac/wiki/PublicPages/MayallZbandLegacy/NotesforObservers/Problems#a0.Noimagesbeingwritten here
The second panel shows the Sky brightness. The "nominal" brightness is shown by the magenta horizontal line. In this panel, the pass number of previous exposures is shown. (This corresponds to the pass we thought the image was going to be, not what the actual conditions delivered.)
The "transparency" panel shows what fraction of the light from stars is getting through the atmosphere to us. Around 90% usually indicates clear photometric conditions.
The "exposure time" panel is complicated. The hollow black dots show the actual exposure time of the images we took. The magenta dots show the exposure time we should have taken, given the measured conditions in that image; it's post-facto what we should have done. We have lower and upper bounds on the exposure times, 80 and 250 seconds. If the "post-facto" target exposure time is below or above the bounds, it is shown with a triangle, and a circle will also be plotted at the lower or upper bound line.
The "depth factor" plot just shows our actual exposure time divided by the post-facto target exposure time. 1 indicates that we're doing exactly what we should be doing. Greater than 1 indicates we're over-exposing, and less than 1 indicates that we're under-exposing. The vertical labels show the exposure numbers.
Note that zeros and focus frames will not show up on the plot.
Notes
At the moment, copilot.py just waits for new images to appear, but you can also tell it to process a set of images (eg, if it crashed and you want it to run the backlog) by specifying the files on the command line. You can also tell it to skip files that already exist in the database via --skip, eg,
python copilot.py --skip $MOS3_DATA/mos3.*.fits
The database just records our CCD measurements, so it's not valuable. If things somehow go wrong and the database gets corrupted or you get git wedged or something, you can always delete it and start over via:
python obsdb/manage.py flush
Attachments (4)
- recent.png (96.4 KB) - added by 9 years ago.
-
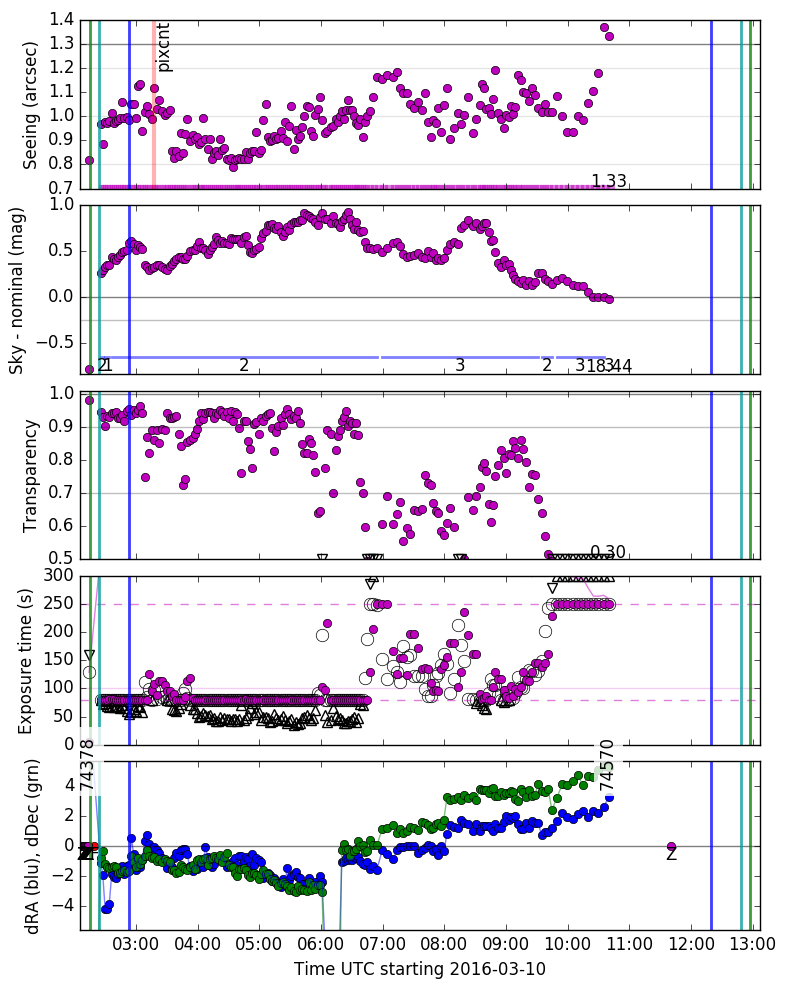
2016-03-09.png (164.2 KB) - added by 9 years ago.
Copilot plot from March 2016
-
copilot-ex-24apr2016.pdf (172.5 KB) - added by 9 years ago.
Marked up copilot example plot
-
copilot-ex-24apr2016.key (780.2 KB) - added by 9 years ago.
Marked up copilot example plot in Keynote format that can be further edited
Download all attachments as: .zip